Introduction
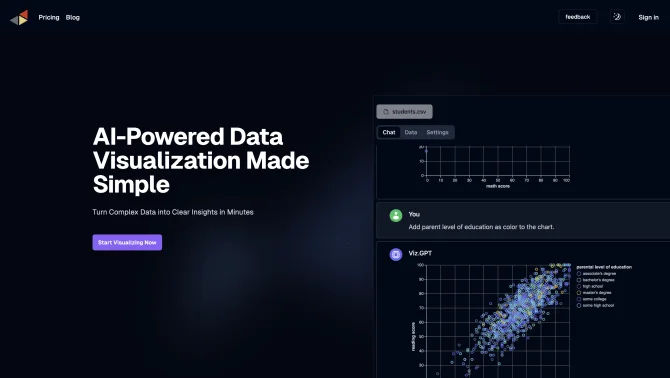
vizGPT is a pioneering data visualization platform that integrates a chat interface with advanced AI models to revolutionize how users interact with data. By utilizing natural language processing, users can effortlessly describe the type of chart they need, and vizGPT generates the corresponding visual representation. Its intuitive interface and powerful AI capabilities make data analysis more accessible and engaging, allowing for quick insights and deeper understanding of complex datasets.
background
Developed by Kanaries Data, Inc., vizGPT represents a significant advancement in the field of data visualization tools. The platform is designed to meet the growing demand for user-friendly and efficient data analysis solutions. With its innovative approach, vizGPT has garnered attention in the tech community and is setting a new standard for data interaction.
Features of vizGPT
Natural Language Processing
Users can interact with vizGPT using natural language to describe their data visualization needs.
Chat Interface
The platform features a chat interface that allows for a conversational approach to data analysis.
Advanced AI Models
vizGPT uses models like chartGPT and vizGPT to understand and generate visual representations from textual input.
Data Visualization
The tool supports a wide range of chart types, from simple bar and line charts to complex heat maps.
Drag-and-Drop Interface
In addition to natural language, users can also utilize a drag-and-drop interface for data visualization.
Data Transformation
Users can easily transform and profile their data using the intelligent data tables provided by vizGPT.
Customization
Visualizations can be customized in terms of color, style, and other aesthetic elements.
Editable Charts
Once generated, charts can be edited and adjusted to fit the user's specific requirements.
Sharing Capabilities
Users can share their visualizations with others for collaboration or presentation purposes.
How to use vizGPT?
To use vizGPT, start by logging into the platform via https://vizgpt.ai/signin. Describe the data visualization you need using natural language. Utilize the drag-and-drop interface or chat interface to refine your visualization. Once satisfied, customize the chart and share it with your team or clients.
Innovative Features of vizGPT
vizGPT's innovation lies in its ability to seamlessly blend natural language understanding with data visualization, creating an intuitive and conversational data analysis experience.
FAQ about vizGPT
- How do I create a visualization with vizGPT?
- Use the chat interface to describe the type of chart and data you want to visualize, and vizGPT will generate it for you.
- What types of charts are supported?
- vizGPT supports a wide range of chart types including bar charts, line charts, scatter plots, and heat maps.
- Can I edit the generated charts?
- Yes, you can customize and edit the charts in terms of style, color, and other elements to match your preferences.
- How do I share my visualizations?
- Once your chart is ready, use the sharing feature to collaborate with others or present your findings.
- Is there a limit to the number of data sources I can use?
- With the Professional plan, you get unlimited access to data sources for your visualizations.
- What is the process for customer support?
- For customer service, email support@vizgpt.ai. They provide assistance with account issues, refunds, and other inquiries.
- How can I provide feedback or report a bug?
- Feedback and bug reports can be directed to the vizGPT team via the support email or through their GitHub page.
- Is there a free trial or demo available?
- Users can try out vizGPT for free to experience its capabilities and determine if it meets their needs.
- What are the system requirements for using vizGPT?
- vizGPT is a web-based platform, so all you need is a modern web browser and an internet connection.
- Can I use vizGPT for collaborative projects?
- Yes, the sharing and editing features of vizGPT make it suitable for team projects and collaborative data analysis.
Usage Scenarios of vizGPT
Academic Research
Use vizGPT to visualize research data, identify trends, and support academic papers with interactive charts.
Market Analysis
Leverage vizGPT for analyzing market trends, consumer behavior, and creating compelling visualizations for reports.
Business Intelligence
Employ vizGPT to transform business data into actionable insights, enhancing decision-making processes.
Education
Incorporate vizGPT in educational settings to teach data analysis and visualization in an engaging and interactive manner.
Product Design
Utilize vizGPT to prototype and test designs by visualizing user data and feedback.
User Feedback
Users have praised vizGPT for its user-friendly interface and the ease with which they can generate visualizations.
Professionals in the field of data analysis have reported significant time savings and increased efficiency when using vizGPT.
New users have noted that the platform has a gentle learning curve, allowing them to become productive quickly.
Designers and analysts appreciate the level of customization available in vizGPT for creating tailored visualizations.
others
vizGPT has been recognized for its innovative approach to data visualization, providing a platform that simplifies the process of turning raw data into actionable insights. The tool's ability to integrate with various data sources and its commitment to continuous improvement based on user feedback set it apart in the market.
Useful Links
Below are the product-related links, I hope they are helpful to you.