Introduction
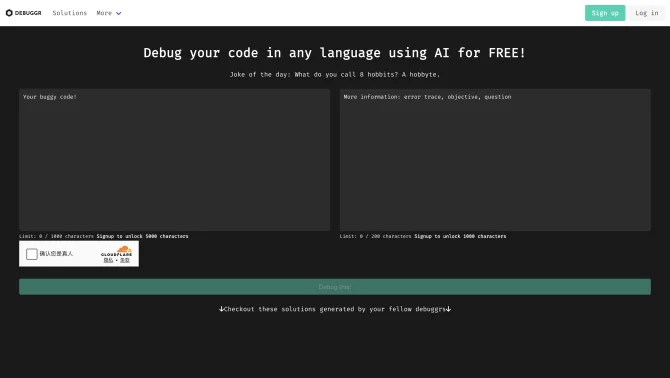
Debuggr.net is a state-of-the-art AI debugger that revolutionizes the way developers approach code debugging. By integrating artificial intelligence, it offers a seamless experience in diagnosing and fixing errors within codebases. The platform's intuitive interface and robust functionality make it an indispensable tool for software development, enhancing productivity and ensuring code quality.
background
In the rapidly evolving tech landscape, Debuggr.net has emerged as a leading solution that addresses the complex challenges faced by developers. With a commitment to innovation, the team behind Debuggr.net is dedicated to providing a tool that simplifies debugging and accelerates development cycles.
Features of Debuggr.net
Crash Analysis
Debuggr.net's AI algorithms analyze crash dumps to quickly identify the source of software failures, providing detailed insights and recommendations.
Memory Leak Detection
The tool is adept at uncovering memory leaks, a common cause of performance degradation, and offers strategies to rectify these issues.
User and Kernel Mode Debugging
Support for both user mode and kernel mode debugging makes Debuggr.net versatile for a range of applications, from desktop software to system-level processes.
Symbol Configuration
Advanced debugging features are unlocked through proper symbol configuration, essential for in-depth analysis of CLR exceptions in .NET applications.
How to use Debuggr.net?
To get started with Debuggr.net, developers should first configure their symbol paths for accurate debugging information. Next, they can utilize the tool's interface to load crash dumps or active processes for analysis. The AI-powered analysis will then provide a step-by-step guide to address the identified issues.
FAQ about Debuggr.net
- How do I configure symbols in Debuggr.net?
- Navigate to the 'Tools' menu, then 'Options and Settings', and set the 'Symbol Path' to your symbol files location.
- Why is my crash analysis not showing results?
- Ensure that you have properly loaded the crash dump file and that symbol configuration is correct.
- Can Debuggr.net detect issues in my production environment?
- Yes, it can analyze issues in real-time and provide insights into production bugs.
- What is the difference between user mode and kernel mode debugging?
- User mode debugging is for applications, while kernel mode is for the operating system and device drivers.
- How can I improve the performance of my debugging sessions?
- Optimize your symbol configuration, ensure your dumps are recent, and utilize the AI suggestions for best results.
Usage Scenarios of Debuggr.net
Software Development
Debuggr.net is ideal for developers seeking to enhance the quality of their code by identifying and fixing bugs efficiently.
Performance Optimization
It can be used by performance engineers to diagnose memory leaks and other performance bottlenecks.
Educational Purposes
Instructors and students can use Debuggr.net for learning about debugging techniques and software analysis.
Research and Development
R&D teams can leverage the tool for in-depth analysis of complex systems and algorithms.
User Feedback
Debuggr.net has been a game-changer for our development team, significantly reducing the time spent on bug fixes.
The AI-driven approach of Debuggr.net offers insights that were not possible with traditional debugging tools.
I was pleasantly surprised by the ease of use and the depth of analysis provided by Debuggr.net.
Debuggr.net's memory leak detection has saved us countless hours and improved our application's performance.
others
Debuggr.net stands out in the crowded field of debugging tools by offering a sophisticated yet user-friendly AI solution that enhances the development process.
Useful Links
Below are the product-related links of Debuggr.net, I hope they are helpful to you.